


By Joseph D’Aleo, CCM
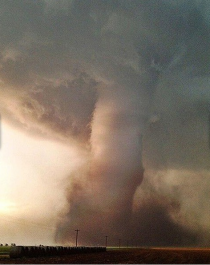
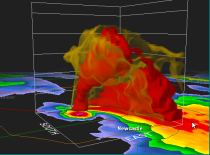
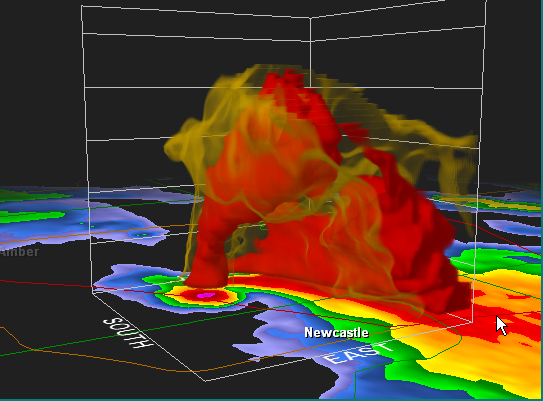
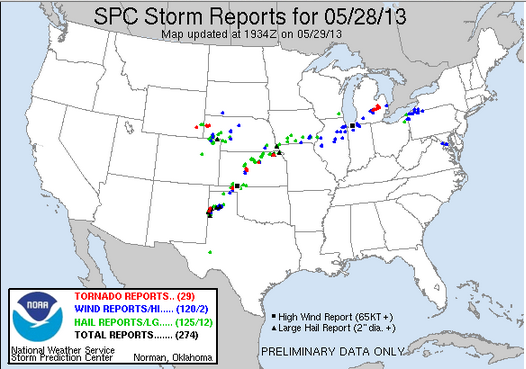
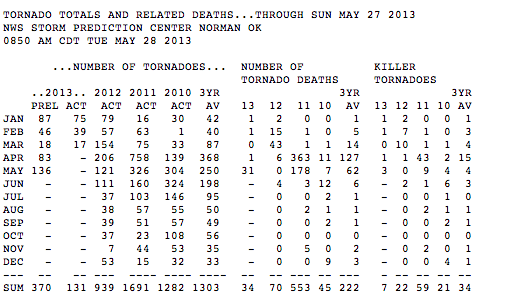
Tuesday was an active severe weather day with 29 reported tornados (preliminary). More outbreaks have occurred this week with a slow moving front. It followed the big EF5 tornado last week at Moore, Oklahoma. It was the first EF5 since 2011. An image and a volumetric radar cross section are shown.

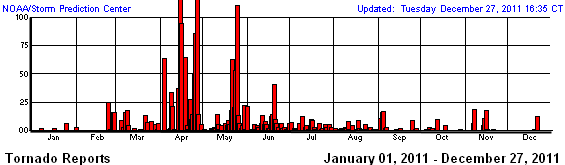
But for the season thus far, we are at the bottom end of the frequency as of the date. When it was active in 2011, the ignorant and opportunists blamed it on global warming. Last spring was very warm and activity was way down. This year, spring ranked among the coldest and activity was very low and only recently has picked up as warmth finally began pushing north to clash with the colder air to the north. Note how temperatures have been cooling .
It is in the region of CONTRAST that the jet stream is energized and severe weather occurs. When it is too warm or too cold from north to south, activity is depressed. Global warming would diminish the contrast north to south and result in weaker storms, a weaker jet stream, fewer tornado outbreak and strong EF3-5 tornadoes. It is in cold springs that outbreaks and strong tornadoes occur as the warmth and moisture eventually advances north to interact with the cold troughs.
_thumb.png)
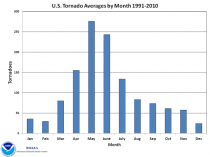
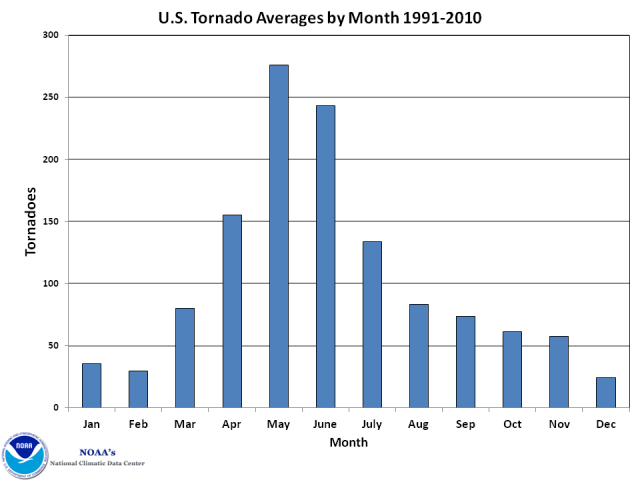
We are passing the peak of the severe weather season. The delayed shift north of the jet stream and alternating cooler and warmer weather will allow for some catch up.
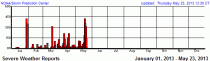
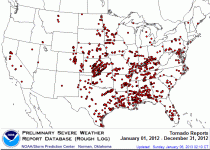
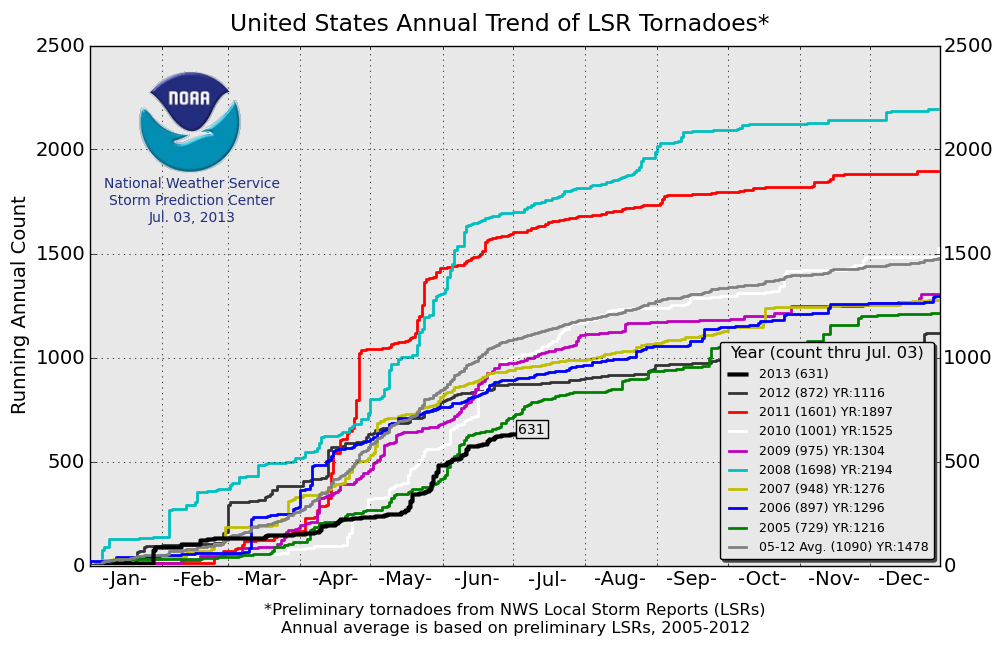
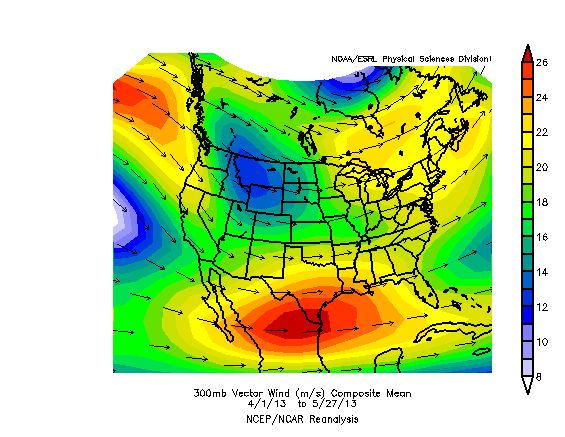
See the activity year to date this year
_thumb.gif)
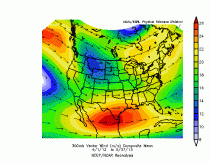
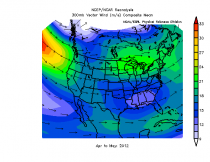
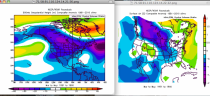
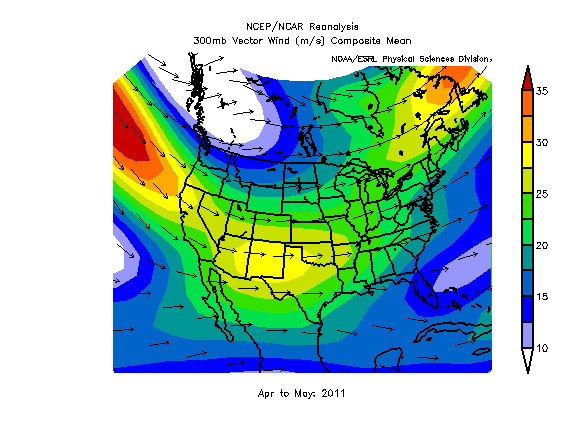
See how suppressed the 300mb jet stream has been on average.
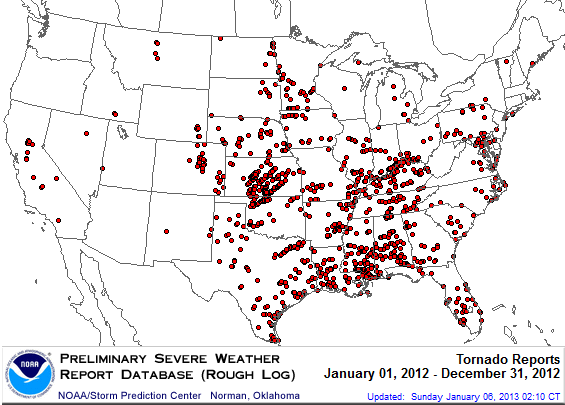
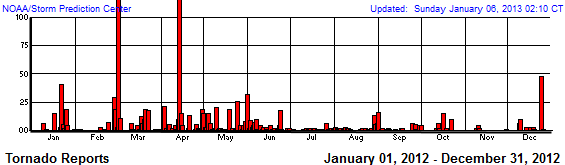
See the activity last year (whole year).
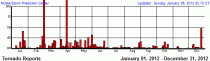
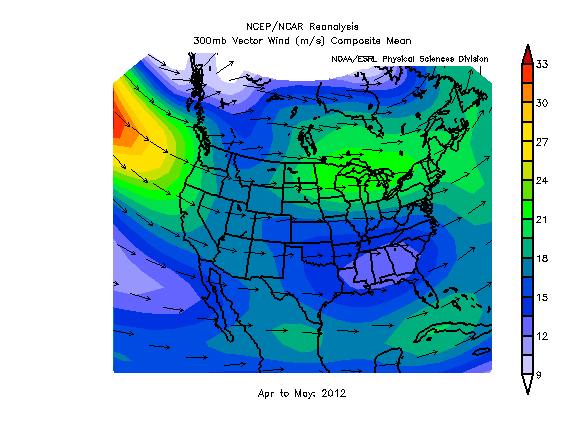
See how far north and weak the jet stream was. Tornadoes were above normal in southern Canada, below in the CONUS.
In 2011, coming off the strongest La Nina since the 1950s or early 1970s, the jet stream was ideal for severe weather with a southern jet and northern jet. Tornadoes were favored to the left front of the southern jet and right rear portion of the northern one. That is where upper divergence is favored.
_thumb.gif)
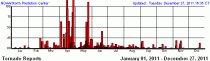

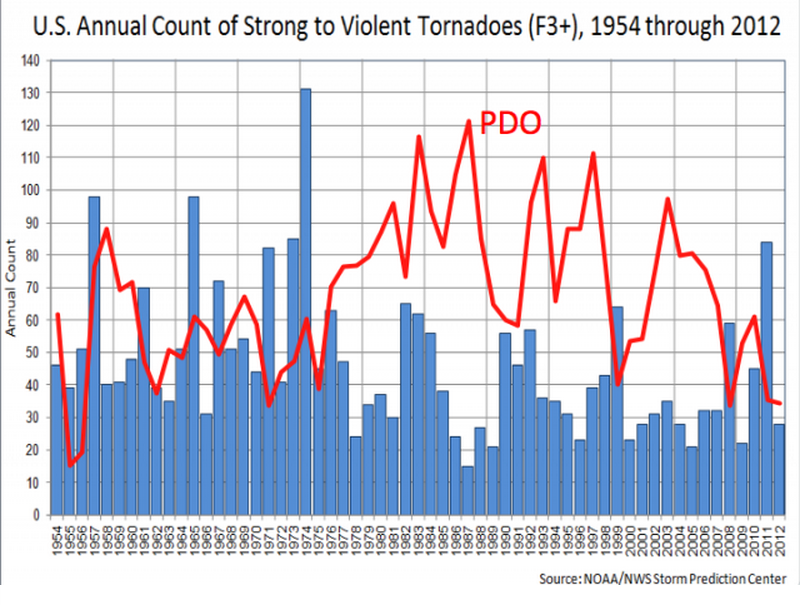
See how the negative PDO which favors La Ninas by 2 or 3 to 1 and favors stronger (EF3-5) tornadoes (and more big outbreaks) correlated well with the EF3-5 counts.

Weatherbell Analytics on Forbes
After a slow start to severe weather season, Monday’s devastating tornado that hit Oklahoma reminds us how costly and destructive the change of seasons can be in the United States. Following one of the coldest March/April stretches in several decades, which caught most of the energy market by surprise, April and the first half of May produced significantly fewer tornadoes than normal. The cold air that overwhelmed the country in March and April resulted in huge natural gas withdrawals, drove prices up some 30% and served as the mitigating factor for thunderstorm development.
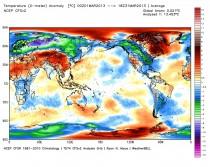
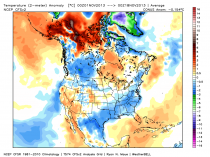
The March global temperature anomaly shows severe cold stretching from Alaska to Florida, as seen below.
As we progressed through May however, warm/moist air from the Gulf of Mexico has finally begun to surge north, creating boundaries between air masses with vastly different characteristics. More tornadoes occur in the U.S. than any other place on earth as a result of this classic setup.
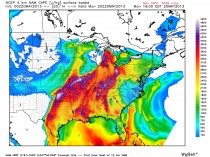
A deep low-pressure system centered over the Dakotas draped a strong cold-front through the plains pulling extremely moist and unstable air from the Gulf of Mexico.
CAPE (Convective Available Potential Energy), a metric of thunderstorm potential, saw extreme values ahead of the frontal boundary especially over Oklahoma during Monday’s tornado outbreak.
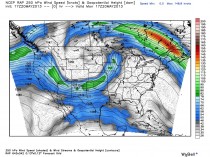
Another main ingredient for tornadogenesis was a strong upper-level jet streak from the southwest, which meant turning winds with height or vertical shear. So far during the spring, Gulf of Mexico moisture and favorable jet stream configurations were almost entirely absent, instead replaced with a cold, persistent northwesterly flow from snowcovered Canada.
The result was was explosive supercell thunderstorm development, as seen in the animation below.
Damage from Monday’s severe weather outbreak is already being estimated to approach $2 billion. With more severe weather on the way, it is inevitable that we will see more damage and life-threatening situations. But on the heels of devastation like this week’s tornado, it is also important to remember that weather like this has always occurred and the current trend is similar to the climate cycle of the 1950s, with a cold Pacific and warm Atlantic. However, with an expanding population and greater suburban and rural development, more people and structures are in the path of deadly storms in the US than in the past.
It is critical to always be alert to the potential of severe weather. Businesses with enterprise alerting systems, which warn decision makers of certain weather events (ex. tornado watch or blizzard warning), can take action to protect physical assets and human life. Alerting systems can also be used by businesses to direct operations to limit financial hardship and in some cases, garner financial profit by avoiding shutdowns or outages.
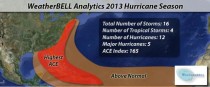
It doesn’t look like hurricane season is going to provide a respite from extreme weather. Joe Bastardi has warned for years that we would enter a period of climactic hardship as a result of the cold PDO (Pacific Decadal Oscillation) and warm AMO (Atlantic Multi-decadal Oscillation). Similar to the 1950s, the United States should experience heightened risk for landfalling hurricanes and higher likelihood of summer heat/drought. We have experienced tremendous heat and drought the last several years. Our summer forecasts calls for the heat to be less of an issue this year, as it should be centered over the Rockies and Texas. We expect a more normal temperature/precipitation profile for the Eastern half of the United States. However, tropical cyclone development should be above normal this year.
We expect an above normal ACE (Accumulated Cyclone Energy), a more meaningful measure of the total energy of tropical systems. The Atlantic sea surface temperature (SST) profile is similar to 2005, which was the most active Atlantic tropical season on record. The water temperatures in the deep tropics are substantially above normal, which should provide extra “fuel” for tropical cyclone development. With no sign of an El Nino, there will be little in the way of upper air shear to tear apart any storms that may form. And similar to the 1950′s, the overall climactic pattern should steer the storms towards the US coastline. Our official forecast can be seen in the chart below. This year’s activity will have far reaching impacts across the energy and insurance markets.
ICECAP NOTE: While the positive AMO (warm Atlantic) and negative PDO (cold Pacific) leads to enhanced Atlantic activty and landfall threat for the east, the cold Pacific (negative PDO) leads to more intense (E3-E5) tornadoes. Come join us at Weatherbell.com for more.
Icecap Note: He is not alone. Today, Senator Boxer rang the bell. Morano Statement: “U.S. Senators Boxer and Whitehouse, and other global warming activists have descended into buffoonery trying to exploit a natural disaster in Oklahoma. Have you no sense of decency, Senators? At long last, have you left no sense of decency or understanding of science?”
Dumbacrat Henry Waxman blamed the tornado, hurricane and fires on CO2 and demanded action. MA Senate wannabe Deadwood Markey and NH Senator Shaheen locally here in New Englandhave been pushing the AGW green (watermelon - green on the outside red on the inside). if they get their way, energy prices will skyrocket and brownouts and blackouts will become common. And $4 gasoline and heating oil will seem like the ‘good old days’. Europe bought the enviro agenda and it almost destroyed their economy with unemployment in Spain rising to 27% and tens of thousands dying all across Europe from 5 brutally cold winters while energy prices rose to levels that made it impossible for them to pay for food and energy. All for the idea that CO2 is behind every extreme weather event even though temperatures have not risen and sea level rises have slowed not accelerated. Scientists in Europe are said to be shocked or dumbfounded that the climate is not following their models. The enviros are in retreat in Europe but on the rise in the US where the demagogue party assumes you have not heard about the failures in Europe or that the Obama green agenda has been a dismal failure at job creation despite the huge subsidies (just as we saw in Europe) has adopted the idea to blame severe weather - explainable entirely by natural cycles - on ‘carbon pollution’.

US Senator Sheldon Whitehouse From Rhode Island Provides Erroneous Information To American Public in Global Warming Rant
Anthony Watts, WattsUpWithThat
First, I’m sure I speak for everyone at WUWT (and Icecap) when I say that our hearts go out to all the families in Oklahoma affected by the weather tragedy there today.
In the video here US Senator Sheldon Whitehouse states that:
“When cyclones tear up Oklahoma and hurricanes swamp Alabama and wildfires scorch Texas, you come to us, the rest of the country, for billions of dollars to recover. And the damage that your polluters and deniers are doing doesn’t just hit Oklahoma and Alabama and Texas.”
Read more: Daily Caller
If Senator Sheldon Whitehouse did more reading and less ranting, he might know that Continental US Temperature Lower Troposphere (TLT) - 1979 to Present;
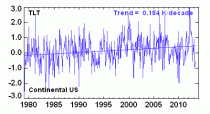
Remote Sensing Systems (RSS) Microwave Sounding Units (MSU) Click to view at source
is currently below average.
US Strong to Violent Tornadoes (EF3-EF5) 1950 to 2012;
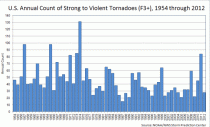
National Oceanic and Atmospheric Administration (NOAA) National Climatic Data Center (NCDC). Click to view at source
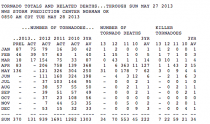
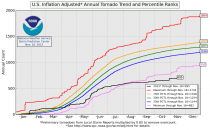
are below average. US Inflation Adjusted Annual Tornado Trend and Percentile Ranks;
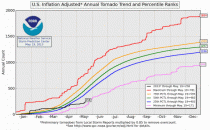
National Oceanic and Atmospheric Administration (NOAA) Storm Prediction Center. Click to view at source
are currently below average. US Tornadoes Daily Count and Running Annual Total;
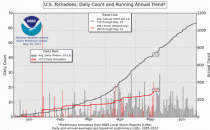
National Oceanic and Atmospheric Administration (NOAA) Storm Prediction Center. Click to view at source
are currently well below average.
US Extremes in Landfalling Tropical Systems 1910 to Present; Annual;
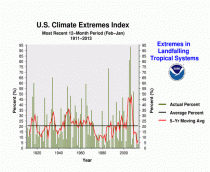
National Oceanic and Atmospheric Administration (NOAA). National Climatic Data Center (NCDC). Click to view at source
are currently below average.
This US Acres Per Wildfire and the Number of Wildfires Per Year graph;
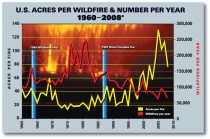
shows that the number of wildfires have decreased, while the acres per fire have increased.
This is an important distinction as the associated article elaborates:
This graph shows the inverse relationship between numbers and sizes of US wildfires over time. Note the greater number and smaller sizes of fires between the creation of Wilderness in 1964 and the beginning of the modern wildfire era in 1987 and 1988 (with Silver Complex and Yellowstone fires of those years), as compared with the smaller number and greater size of recent fires. One factor may be the shift in USFS policy from rapid suppression to “let it burn,” which has allowed for numerous smaller fires previously extinguished individually to coalesce into larger fires and singular complexes. Evergreen
For reference;
“Forest managers agree that the current fire risk is primarily a combination of two factors “ higher-than-average temperatures and a profusion of fuel, the product of nearly a century of fire suppression policies.”
“Recognizing widespread overgrowth in American forests, in the late 1970s the Forest Service began reintroducing policies of prescribed burning and allowed many smaller, natural fires to burn out on their own, provided they didn’t threaten lives or property. The decision this summer to attack all fires, while not a direct reversal of this policy, does represent a departure from that practice of natural restoration, said Jennifer Jones, a public affairs specialist with the Forest Service. Scientific America
The shift in thinking was formalized in a 1995 statement of federal fire policy, and strengthened in a 2001 revision. The policy recognizes that fire is “an essential ecological process,” and that decades of trying to keep fires from burning have led, ironically, to “larger and more severe” conflagrations because of the buildup of underbrush and other fuel. USA Today
As such, US Forest Fire data is biased by “nearly a century of fire suppression policies” and “the shift in USFS policy from rapid suppression to ‘let it burn,’”, which begin “in the late 1970s”, “was formalized in a 1995 statement of federal fire policy, and strengthened in a 2001 revision.” Furthermore, given that continental US Temperatures are currently below average, it is absurd to blame to recent forest fire activity on Global Warming.
US Senator Sheldon Whitehouse used the tragic weather events in Oklahoma to spout erroneous alarmist Global Warming rhetoric. Mr Sheldon, less ranting, more reading…
---------
Anthony: Unfortunately, there is shameful precedence for this sort of opportunistic political rhetoric, WUWT readers may recall when the Center for American progress blamed southern conservatives voting record for tornadoes:
Never let a good crisis go to waste: tornado deaths blamed on lawmakers opposed to climate legislation
NOAA practices advocacy science with major errors / lies about CO2 in official release
Carbon Dioxide at NOAA’s Mauna Loa Observatory reaches new milestone: Tops 400 ppm
May 10, 2013
Contact: John Ewald, 240-429-6127
On May 9, the daily mean concentration of carbon dioxide in the atmosphere of Mauna Loa, Hawaii, surpassed 400 parts per million (ppm) for the first time since measurements began in 1958. Independent measurements made by both NOAA and the Scripps Institution of Oceanography have been approaching this level during the past week. It marks an important milestone because Mauna Loa, as the oldest continuous carbon dioxide (CO2) measurement station in the world, is the primary global benchmark site for monitoring the increase of this potent heat trapping gas.nonsense
Carbon dioxide pumped into the atmosphere by fossil fuel burning and other human activities is the most significant greenhouse gas (GHG) contributing to climate change. Its concentration has increased every year since scientists started making measurements on the slopes of the Mauna Loa volcano more than five decades ago. The rate of increase has accelerated since the measurements started, from about 0.7 ppm per year in the late 1950s to 2.1 ppm per year during the last 10 years.
“That increase is not a surprise to scientists,” said NOAA senior scientist Pieter Tans, with the Global Monitoring Division of NOAA’s Earth System Research Laboratory in Boulder, Colo. “The evidence is conclusive that the strong growth of global CO2 emissions from the burning of coal, oil, and natural gas is driving the acceleration.”
Before the Industrial Revolution in the 19th century, global average CO2 was about 280 ppm. During the last 800,000 years, CO2 fluctuated between about 180 ppm during ice ages and 280 ppm during interglacial warm periods. Today’s rate of increase is more than 100 times faster than the increase that occurred when the last ice age ended.
NOAA’s Mauna Loa Observatory in Hawaii. Thursday, levels of the greenhouse gas carbon dioxide at Mauna Loa surpassed 400 parts per million for the first time since measurements began in 1958. Pre-industrial carbon dioxide levels were 280 parts per million.
It was researcher Charles David Keeling of the Scripps Institution of Oceanography, UC San Diego, who began measuring carbon dioxide at Mauna Loa in 1958, initiating now what is known as the “Keeling Curve.” His son, Ralph Keeling, also a geochemist at Scripps, has continued the Scripps measurement record since his father’s death in 2005.
“There’s no stopping CO2 from reaching 400 ppm,” said Ralph Keeling. “That’s now a done deal. But what happens from here on still matters to climate, and it’s still under our control. It mainly comes down to how much we continue to rely on fossil fuels for energy.”
NOAA scientists with the Global Monitoring Division have made around-the-clock measurements there since 1974. Having two programs independently measure the greenhouse gas provides confidence that the measurements are correct.
Moreover, similar increases of CO2 are seen all over the world by many international scientists. NOAA, for example, which runs a global, cooperative air sampling network, reported last year that all Arctic sites in its network reached 400 ppm for the first time. These high values were a prelude to what is now being observed at Mauna Loa, a site in the subtropics, this year. Sites in the Southern Hemisphere will follow during the next few years. The increase in the Northern Hemisphere is always a little ahead of the Southern Hemisphere because most of the emissions driving the CO2 increase take place in the north.
Once emitted, CO2 added to the atmosphere and oceans remains for thousands of years.more nonsense. Tom Segalstad has shown many papers found the lifetime is just 5-7 years. Thus, climate changes forced by CO2 depend primarily on cumulative emissions, making it progressively more and more difficult to avoid further substantial climate change. Direct chemical measurements (90,000) in Europe showed CO2 was higher in the 1940s and 1800s than it is currently.
See compilation of replies in Climate Depot Special Report “CO2 nears 400ppm. Relax it is not global warming end times but only a big yawn”
---------
In Defense of Carbon Dioxide
The demonized chemical compound is a boon to plant life and has little correlation with global temperature.
By HARRISON H. SCHMITT AND WILLIAM HAPPER
Of all of the world’s chemical compounds, none has a worse reputation than carbon dioxide. Thanks to the single-minded demonization of this natural and essential atmospheric gas by advocates of government control of energy production, the conventional wisdom about carbon dioxide is that it is a dangerous pollutant. That’s simply not the case. Contrary to what some would have us believe, increased carbon dioxide in the atmosphere will benefit the increasing population on the planet by increasing agricultural productivity.
The cessation of observed global warming for the past decade or so has shown how exaggerated NASA’s and most other computer predictions of human-caused warming have been-and how little correlation warming has with concentrations of atmospheric carbon dioxide. As many scientists have pointed out, variations in global temperature correlate much better with solar activity and with complicated cycles of the oceans and atmosphere. There isn’t the slightest evidence that more carbon dioxide has caused more extreme weather.
The current levels of carbon dioxide in the earth’s atmosphere, approaching 400 parts per million, are low by the standards of geological and plant evolutionary history. Levels were 3,000 ppm, or more, until the Paleogene period (beginning about 65 million years ago). For most plants, and for the animals and humans that use them, more carbon dioxide, far from being a “pollutant” in need of reduction, would be a benefit. This is already widely recognized by operators of commercial greenhouses, who artificially increase the carbon dioxide levels to 1,000 ppm or more to improve the growth and quality of their plants.
Using energy from sunlight - together with the catalytic action of an ancient enzyme called rubisco, the most abundant protein on earth - plants convert carbon dioxide from the air into carbohydrates and other useful molecules. Rubisco catalyzes the attachment of a carbon-dioxide molecule to another five-carbon molecule to make two three-carbon molecules, which are subsequently converted into carbohydrates. (Since the useful product from the carbon dioxide capture consists of three-carbon molecules, plants that use this simple process are called C3 plants.) C3 plants, such as wheat, rice, soybeans, cotton and many forage crops, evolved when there was much more carbon dioxide in the atmosphere than today. So these agricultural staples are actually undernourished in carbon dioxide relative to their original design.

Corbis
At the current low levels of atmospheric carbon dioxide, rubisco in C3 plants can be fooled into substituting oxygen molecules for carbon-dioxide molecules. But this substitution reduces the efficiency of photosynthesis, especially at high temperatures. To get around the problem, a small number of plants have evolved a way to enrich the carbon-dioxide concentration around the rubisco enzyme, and to suppress the oxygen concentration. Called C4 plants because they utilize a molecule with four carbons, plants that use this evolutionary trick include sugar cane, corn and other tropical plants.
Although C4 plants evolved to cope with low levels of carbon dioxide, the workaround comes at a price, since it takes additional chemical energy. With high levels of carbon dioxide in the atmosphere, C4 plants are not as productive as C3 plants, which do not have the overhead costs of the carbon-dioxide enrichment system.
That’s hardly all that goes into making the case for the benefits of carbon dioxide. Right now, at our current low levels of carbon dioxide, plants are paying a heavy price in water usage. Whether plants are C3 or C4, the way they get carbon dioxide from the air is the same: The plant leaves have little holes, or stomata, through which carbon dioxide molecules can diffuse into the moist interior for use in the plant’s photosynthetic cycles.
The density of water molecules within the leaf is typically 60 times greater than the density of carbon dioxide in the air, and the diffusion rate of the water molecule is greater than that of the carbon dioxide molecule.
So depending on the relative humidity and temperature, 100 or more water molecules diffuse out of the leaf for every molecule of carbon dioxide that diffuses in. And not every carbon dioxide molecule that diffuses into a leaf gets incorporated into a carbohydrate. As a result, plants require many hundreds of grams of water to produce one gram of plant biomass, largely carbohydrate.
Driven by the need to conserve water, plants produce fewer stomata openings in their leaves when there is more carbon dioxide in the air. This decreases the amount of water that the plant is forced to transpire and allows the plant to withstand dry conditions better.
Crop yields in recent dry years were less affected by drought than crops of the dust bowl droughts of the 1930s, when there was less carbon dioxide. Nowadays, in an age of rising population and scarcities of food and water in some regions, it’s a wonder that humanitarians aren’t clamoring for more atmospheric carbon dioxide. Instead, some are denouncing it.
We know that carbon dioxide has been a much larger fraction of the earth’s atmosphere than it is today, and the geological record shows that life flourished on land and in the oceans during those times. The incredible list of supposed horrors that increasing carbon dioxide will bring the world is pure belief disguised as science.
A version of this appeared in the WSJ. Mr. Schmitt, an adjunct professor of engineering at the University of Wisconsin-Madison, was an Apollo 17 astronaut and a former U.S. senator from New Mexico. Mr. Happer is a professor of physics at Princeton University and a former director of the office of energy research at the U.S. Department of Energy.
----------
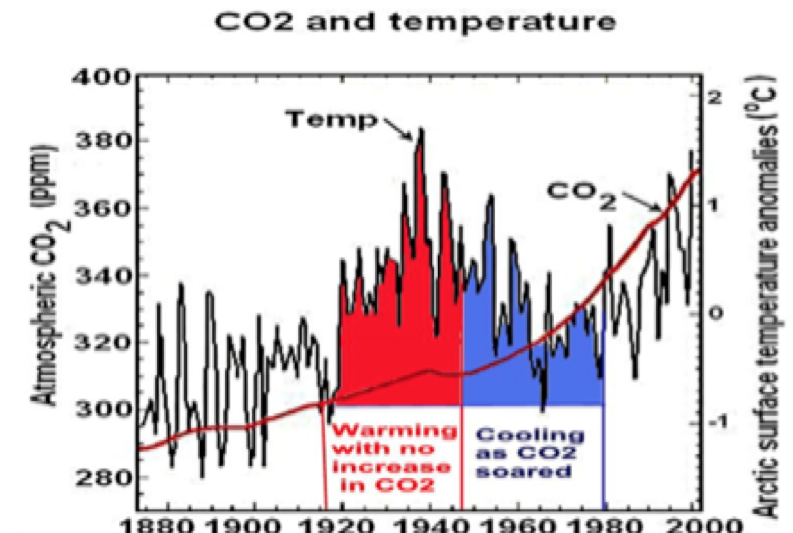
The once great New York Times in denial on Benghazi is also carrying the water for the liar enviros and psuedo scientists with Justin Gillis’s continuing series of liar stories on CO2 impact here. Justin claims CO2 is the highest it has even been in the history of the earth. As you can see numerous studies have shown we are near the LOWEST levels in history. We need to push for higher CO2 to maximize crop production and drought resistance, and minimize water needs.
It also shows no convincing evidence of being associated with temperature changes.

Please bring back Andy Revkin, Gillis is clueless and NYT go back to covering ‘all the news thats fit to print’ accurately and in an unbiased way or you deserve to fail. And NOAA get back to covering weather and stop your advocacy science. Management nonsense is why employees on the front line gave management in NWS such low grades in survey.
By P Gosselin on 21. April 2013
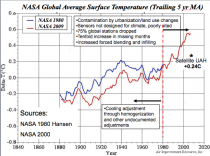
Climate science/renewable energy critic Rainer Hoffmann has researched the literature on mean global surface temperature.
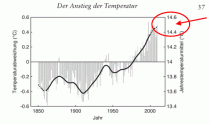
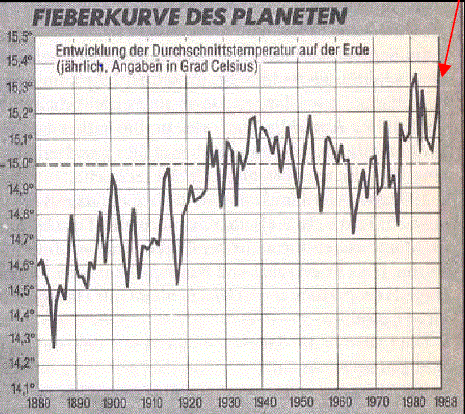
Stunningly, he shows that something is not right with the figures coming from the world’s leading climate experts. The figures tell us the mean global surface temperature has dropped 1C over the last 25 years. At that rate, we’ll be in an ice age by the year 2100!
Page 1 of Hoffmann’s two-page pdf file shows literature that says the mean global temperature in 1990 was 15.5C. Page 2 shows the literature that says it is now only 14.5C.
Here’s a chronology of the global mean surface temperature figures from the leading experts over the last 25 years:
1988: 15.4C
Der Spiegel, based on (untampered) data from NASA (see chart below, enlarged here).
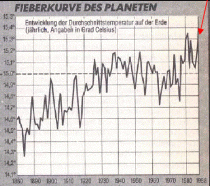
1990: 15.5C
According to James Hansen and 5 other leading scientists; they too claimed the global mean surface temperature was 15.5C. Also Prof. Christian Schonwiese claimed the same in his book ‘Klima im Wandel’, pages 73, 74 and 136. 15.5C is also the figure given by a 1992 German government report, based on satellite data.
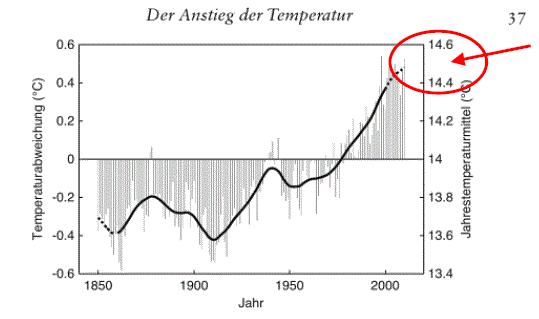
2004: 14.5C
14 years later, the temperature mysteriously drops to 14.5C, according to professors Hans Schellnhuber and Stefan Rahmstorf in their book: “Der Klimawandel”, 1st edition, 2006, p 37, based on surface station data from the Hadley Center.
2007: 14.5C
And also according to the Holy Climate Bible, the IPCC WG1 AR4 (page 6 of bmbf.de/pub/IPCC2007.pdf).
2010: 14.5C
Reconfirmed by Professors Schellnhuber and Rahmstorf in their book: Der Klimawandel, 7th edition, 2012, page 37, (see chart below, enlarged here) based on surface station data.
2012: 14.5C
Also given by Prof Mojib Latif, March 20, 2012.
Read much more here.
by KIM GREENHOUSE on MAY 6, 2013
in ACADEMIA, ENVIRONMENT, SCIENCE & TECHNOLOGY

Don Easterbrook
Dr. Don Easterbrook returns to the show after recently testifying before the Senate Energy, Environment & Telecommunications Committee in Olympia, Washington. His testimony supported by 50 years of work in climate change and jam-packed with verifiable facts that stand to alter the picture many have ingested about climate and weather offered mind-blowing insights about the difference between data and dogma. An honest comparison of Dr. Easterbrook’s information with the propaganda about climate change will inspire even the most ardent climate change environmentalist to take note. Dr. Easterbrook was subsequently attacked by his own institution (among others), who ran character assassination pieces in Associated Press to frame him as a quack.
After producing over 30 segments on climate change, it is clear that the facts are totally accessible, understandable, and cannot be manipulated to suit a political agenda. Join us as we invite Dr. Don Easterbrook and astrophysicist Dr. Gordon Fulks to discuss recent events and lay out important, current information supporting a whole systems approach to climate change clarity.
LISTEN TO THIS MP3. A must hear.
-----------
Ignoratio elenchi
By Joseph D’Aleo, CCM
The former Weather Channel stuck to its knitting and provided a needed service and quality information. But under brain dead NBC Universal leadership it has become a laughing stock. Outside of a Sandy like event, ratings are in the tank and deserve to be there. Al Roker assigned part-time to lighten up the boring coverage of a network that can’t decide whether its National Geographic light or a legitimate real-time information source, when asked about global warming said “ I have just two words for you “Superstorm Sandy”. I need just one word for you Al why global warming is even in the lexicon “$100B”. Governments and leftist enviro groups and individuals have bought the scientists and their organizations.
This video says it all.
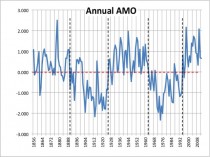
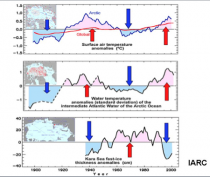
Stu Ostro used to be a meteorologist with a balanced view on natural climate change. Then Heidi Cullen became his supervisor and NBC Universal his boss. He appears in this feature blaming arctic warming (5 months after it froze over) for the “long, cold winter”. He used Jennifer Francis from Rutgers who had done papers connecting the Atlantic Multidecadal Oscillation warming to reduction of ice in the arctic. She blamed climate change for that warming and the arctic for the weather. I served on the AMS council with her. I credit her for recognizing the already known connection of the ocean temperatures in the Atlantic with arctic warming and ice. I challenge her to make the connection with CO2. See how AMO cycles even as CO2 rises.
Neither noted that the ice reduction was in the summer and the ice returned by October and the snow started in February and continued into May. That is what Aristotle called an Ignoratio elenchi, an irrelevant conclusion or fallacy of presenting an argument that may or may not be logically valid, but fails nonetheless to address the issue in question.
The word ‘oscillation’ got lost in their thinking. The IARC at the University of Alaska Fairbanks showed how the cycle in the Atlantic leads to warming and cooling and reduction and recovery of arctic ice historically.
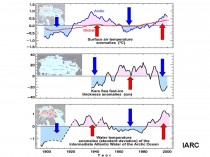
See in this piece how natural factors lead to these cyclical changes in ice and temperatures. The bottom line is that the warm Atlantic causes a reduction of arctic ice in summer and increased high latitude blocking which leads to colder winters in Eurasia and North America. Atmospheric CO2 is irrelevant.

As Joe Bastardi posted on weatherbell.com, look at the pattern in March to May the clueless Ostro and Frances claimed was so unusual and due to climate change but back in the 1950s when the oceans were in the same phase of their 60 to 70 year cycles. 500mb is on the left and surface temperatures the right.
TWC has some credible people too...like Tom Niziol, formerly of NWS in BUF and Tom Moore and few others behind the scenes but the number dwindles.
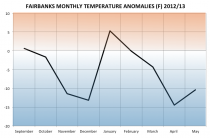
And as for allegedly the warm arctic regions, take a look at Fairbanks, Alaska since the fall. For the secon stright year, brutal cold.
Joseph D’Aleo, CCM
It’s May, time to mow the lawn.
H/T Meteorologist Andre Bernier
Here is a time lapse of 15 inches of snow falling overnight.
All time record snowstorm winds down today after setting May Records from Minnesota to Arkansas.
_thumb.jpg)
NWS WEATHER PREDICTION CENTER COLLEGE PARK MD
400 AM CDT FRI MAY 03 2013
...UNPRECEDENTED MAY WINTER STORM BEGINNING TO TAPER OFF FROM THE
MIDDLE MISSISSIPPI RIVER VALLEY NORTHWARD INTO THE UPPER MIDWEST…
...IOWA…
CHARITON 12.0
BRITT 11.0
FOREST CITY 2 NNE 11.0
ST ANSGAR 10.9
ALGONA 5 NE 10.5
MONA 10.0
ALLERTON 4 S 10.0
NORTHWOOD 9.7
MASON CITY 9.5
CHARLES CITY COOP 9.0
GARNER 8.5
GRUNDY CENTER 8.0
INDIANOLA 0.8 SSW 8.0
WHITTEMORE 3 NNW 7.3
DUMONT 7.0
MANLEY 3 WSW 7.0
SCHLESWIG 0.4 NE 7.0
OSAGE 7.0
HUMESTON 7.0
RICEVILLE 7.0
DES MOINES INTL 6.9
RINGSTED 6.5
ALTOONA 1 ESE 6.5
SIOUX RAPIDS 4 E 6.2
PARKERSBURG 6.0
FORT DODGE 5.5
NEWTON 3 WNW 5.5
ION 5.5
WEST AMES 5.3
NASHUA 5.1
JOHNSTON 5.0
ELMA 4.9
IOWA FALLS 1 ESE 4.5
MADRID 4.2
...KANSAS…
TRAER 2.5 NNW 5.3
SHARON SPRINGS 10 S 5.1
MANNING 4 NW 5.0
SCOTT CITY 10.7 ENE 5.0
GOODLAND 12.1 NW 4.5
STILLWELL 1 N 3.0
GARDEN CITY 3.0
OVERLAND PARK 2.5
DUNLAP 2.0
LAKIN 2.0
ST. FRANCIS 12 NNW 2.0
ULYSSES 2.0
TOPEKA 7 SW 1.0
...MICHIGAN…
BESSEMER 1 E 13.0
IRONWOOD 11.0
ONTONAGON 6 ESE 6.0
HERMAN 3.2
ISHPEMING 2.7
...MINNESOTA…
BLOOMING PRAIRIE 18.0
GOODHUE 17.5
DODGE CENTER 17.2
RICE LAKE 17.0
ROCHESTER 2.5 W 16.6
BYRON 6 S 16.0
ELLENDALE 15.8
OWATONNA 2 E 15.5
DODGE CENTER 15.4
ZUMBROTA 15.1
ELLENDALE 15.0
OAK CENTER 15.0
CLAREMENT 2.5 SSE 14.9
ROCHESTER 2 SW 14.8
SEELEY 14.2
HAYFIELD 7 WSW 14.0
MAPLE SPRINGS 1 S 14.0
ROCHESTER 14.0
RED WING 13.5
NERSTRAND 4 E 13.4
ELGIN 2 SSW 13.1
SPRING VALLEY 3E 12.9
EYOTA 5 SW 12.0
CHATFIELD 9 ESE 11.9
ELBA 5 SW 11.0
ST CHARLES 5N 11.0
MANTORVILLE 2 ESE 9.0
OSTRANDER 8.5
...MISSOURI… ...MISSOURI…
WARRENSBURG 7S 6.0
CHILLICOTHE 3E 6.0
MILAN 1.2 SW 6.0
PRINCETON 1.5 NE 5.5
BRAYMER 5.5
TRENTON 1.4 N 4.5
CARTHAGE .8 S 4.4
STOCKTON 4.0
UNIONVILLE 4.0
CENTERVIEW 3W 4.0
LOWRY CITY 4.0
NEOSHO 4.0
SE ODESSA 4.0
AURORA 3.5
GARDEN CITY 3.1
CENTERVIEW 3 WSW 3.0
N WINSTON 3.0
CARTHAGE 3.0
SARCOXIE 3W 3.0
BROOKFIELD 10 N 3.0
PINEVILLE 2NNW 3.0
APPLETON CITY 3.0
LEES SUMMIT 2.7
GRAIN VALLEY 2.5
KANSAS CITY 11 SSE 2.5
CEDAR SPRINGS 2.5
WARRENSBURG 7 WNW 2.5
INDEPENDENCE 2.0
PATTONSBURG 2.0
VIBBARD 2.0
HALLTOWN 1W 2.0
ASH GROVE 2.0
GALLATIN 1.5
WINSTON 1.5
SPRINGFIELD 0.6
...WISCONSIN…
STOCKHOLM 3 NE 17.7
MELLEN 19 SW 17.0
RICE LAKE 17.0
ASHLAND 16.3
CAMERON 1 NE 16.0
MENOMONIE 16.0
ELLSWORTH 6 WSW 16.0
HAYWARD 8 S 16.0
MELLEN 2 NW 16.0
STONE LAKE 2 NW 15.5
COLFAX 15.5
BALDWIN 14.7
CHETEK 2 SE 14.3
BARRON 14.0
GRAND VIEW 14.0
MAIDEN ROCK 3 NNW 14.0
RICE LAKE 5 NE 14.0
SPRING VALLEY 3 NW 14.0
ARKANSAS 4 NW 13.5
ELK MOUND 1 NE 13.4
LADYSMITH 2 WNW 12.9
RIVER FALLS 1 SSW 11.0
CORNUCOPIA 10.0
EAU CLAIRE 9.3
NW PRESCOTT 7.8
...ARKANSAS…
DECATUR 2.6 E 5.0
GRAVATTE 3.5
MAYSVILLE 3.0
WEST GENTRY 3.0
BELLA VISTA 2.5
PRARIE GROVE 1 NE 2.0
BEAVER LAKE 1.8
BEAVER 1 S 1.2
SPRINGDALE 1.0
CENTERTON 1.0
CAVE SPRINGS 1.0
WINSLOW 7 NE 1.0
EUREKA SPRINGS 0.8
FAYETTEVILLE 0.5
...OKLAHOMA…
WEST SILOAM SPRINGS 6 W 1.5
MUSE 4 N 1.0
WESTVILLE 1.0
...COLORADO…
BUCKHORN MOUNTAIN 1 E 28.2
PINGREE PARK 3 WNW 24.0
STOVE PRAIRIE 2 WNW 23.0
ESTES PARK 1.8 S 19.4
LIVERMORE 9.9 WSW 19.0
CAMERON PASS 1 NNW 18.0
FORT COLLINS 2 ENE 16.0
TRAIL RIDGE 5 N 16.0
BRECKENRIDGE 2 SSE 15.3
GLEN HAVEN 1.6 NE 15.0
DRAKE 5.3 WNW 14.5
NEDERLAND 4 ENE 14.5
WARD 5 NE 14.5
BOULDER 2 SSW 8.0
DENVER 3 SE 5.0
...NEBRASKA…
DALTON 0.4 SE 8.5
LODGEPOLE 8.1 N 5.7
GERING 10.1 S 5.0
SCOTTSBLUFF 2.7 WNW 4.2
BAYARD 13.5 NNE 4.0
ELLSWORTH 4.0
OMAHA 3.3
BELLEVUE 3.1
ARTHUR 3.0
BENKELMAN 3.0
MULLEN 3.0
VALLEY 3.0
ELKHORN 2.7
VALLEY 1 N 2.4
COLERIDGE 2.0
...SOUTH DAKOTA…
BERESFORD 2 S 6.0
HARTFORD 0.5 N 2.1
SIOUX FALLS 3.4 ESE 2.0
...WYOMING…
WARREN AFB 20.6 WSW 22.3
LANDER 5.7 SW 18.7
CHEYENNE 15 W 15.0
CARPENTER 3.9 NNE 12.0
WHEATLAND 20.0 SW 9.1
PINE BLUFFS 0.8 SW 9.0
SOUTH GREELEY 6.2 SW 9.0
BURNS 6 WNW 8.5
HILLSDALE 0.1 N 8.5
LA GRANGE 4.4 ESE 8.1
YODER 6.5 SSE 7.5
LARAMIE 1 N 6.0
-----------------
ALL-TIME MINNESOTA MAY SNOWFALL RECORD?
At 7 AM Thursday, the cooperative observer in Dodge Center, MN reported 15.4 inches. If this record is confirmed by the Minnesota State Climate Extremes committee, it would surpass the May daily snowfall record for the state of Minnesota. This record currently stands at 12 inches in St Cloud (May 17, 1890), Windom (May 8, 1938), and 8 miles north of Leonard (May 3, 1954).
-----------
RECORD EVENT REPORT
NATIONAL WEATHER SERVICE DES MOINES IA 110 AM CDT THU MAY 02 2013
..RECORD DAILY MAXIMUM SNOWFALL SET AT DES MOINES IA FOR MAY 2ND
A RECORD SNOWFALL OF 3.4 INCHES FELL AT DES MOINES IA ON THURSDAY. THIS BREAKS THE OLD RECORD OF TRACE SET IN 1976.
THE 3.4 INCHES OF SNOW ALSO IS THE HIGHEST SINGLE DAY MAY SNOW TOTAL FOR DES MOINES. THE PREVIOUS RECORD WAS 1.2 INCHES SET ON MAY 3, 1907.
THE TOTAL FOR THE STORM WAS 6.9 INCHES. THIS IS ALSO THE HIGHEST AMOUNT OF SNOW EVER RECEIVED IN THE MONTH OF MAY FOR DES MOINES. THE PREVIOUS RECORD WAS 1.3 INCHES SET DURING MAY OF 1907.
-------------
NATIONAL WEATHER SERVICE LA CROSSE WI 807 PM CDT THU MAY 2 2013
..UNPRECEDENTED SNOWFALL FOR ROCHESTER MINNESOTA
WHAT A STORM FOR THE RECORD BOOKS. THE INFORMATION BELOW SHOWCASES HOW THIS SNOWSTORM RANKS FROM A MAY PERSPECTIVE...AND ALSO THE ENTIRE CALENDAR YEAR.
THE 13.9 INCHES...THROUGH 730 PM...BREAKS THE FOLLOWING RECORDS…
...DAILY RECORD SNOWFALL FOR MAY 2ND / 0.7 INCHES IN 1954 /
...DAILY RECORD SNOWFALL FOR MONTH OF MAY / 1.2 INCHES MAY 5 1944/
...MAY MONTHLY SNOWFALL TOTAL / 2.0 INCHES MAY 1944 /
IT CURRENTLY RANKS AS SIXTH GREATEST ALL-TIME DAILY SNOWFALL. THIS WILL LIKELY RISE ONCE THE OFFICIAL SNOW TOTAL IS REPORTED.
ALL-TIME 1-DAY SNOWFALL RECORDS
ROCHESTER MINNESOTA
1886-2013
RANK SNOWFALL YEAR
---- ------------- -------
1 19.8 INCHES 3/18/2005
2 15.4 INCHES 1/22/1982
3 15.0 INCHES 12/11/2010
4 14.0 INCHES 3/30/1934
4/20/1893
6 13.9 INCHES 5/02/2013
7 13.5 INCHES 2/27/1893
8 13.0 INCHES 4/26/1988
9 12.0 INCHES 11/30/1934
TO PUT THIS SNOWSTORM IN ANOTHER PERSPECTIVE...TODAYS SNOWFALL IN ROCHESTER SHATTERS THE COMBINED TOTAL FOR ALL PREVIOUS MAY MEASURABLE SNOW EVENTS. SINCE 1886...THERE WERE 10 MEASURABLE MAY EVENTS...FOR A TOTAL OF 4.3 INCHES. TODAYS SNOWFALL IS OVER 3 TIMES THAT.
By Steve Goreham
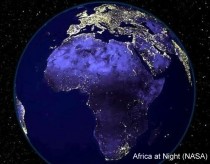
Africa at night
Originally published in The Washington Times.
Last week, thirteen members of the House of Representatives introduced a resolution “recognizing the disparate impact of climate change on women.” The resolution implied that man-made climate change was responsible for impacts on global women, stating “food insecure women with limited socioeconomic resources may be vulnerable to situations such as sex work, transactional sex, and early marriage that put them at risk for HIV, STIs, unplanned pregnancy, and poor reproductive health.” But the resolution ignores the real tragedy, the tragedy of misguided policies to combat climate change.
Climatism, the belief that man-made greenhouse gases are destroying Earth’s climate, has guided world governments since 1992. That year, 41 nations and the European Community signed the Framework Convention on Climate Change (FCCC) at the Rio de Janeiro Earth Summit. The FCCC called for reductions in greenhouse gas emissions to prevent dangerous global warming. For 21 years, world leaders have argued about how and when to reduce emissions. Today, 192 of 193 heads of state say they believe in man-made warming and most are pursing policies to try to stop climate change.
But, rather than beneficial, efforts to “fight” man made climate change actually injure people in developing nations. The ideology of Climatism demands that nations forego the use of fossil fuel, use less energy, and force use of expensive or unreliable wind, solar, or biofuel alternatives. Poverty, lack of jobs, and lack of modern energy foster prostitution in developing nations. Climate change from emissions of carbon dioxide, a trace gas in our atmosphere, is a negligible factor.
The United Nations has long criticized the use of “unsustainable energy.” In a 2010 report on Asia, the UN warned, “Asia-Pacific countries must undergo structural adjustment to make key policy changes needed to switch their development mode...Most member countries have followed the industrial model of developed countries, which is the root cause of climate change. This traditional industrial development model results in an unsustainable energy consumption pattern.” The paper says nations must “pursue a low carbon development path” and skip a “growth path heavily reliant on pollutants.” The report goes on to question whether televisions, computers, and networking through the internet are necessary activities.
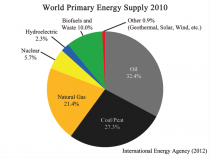
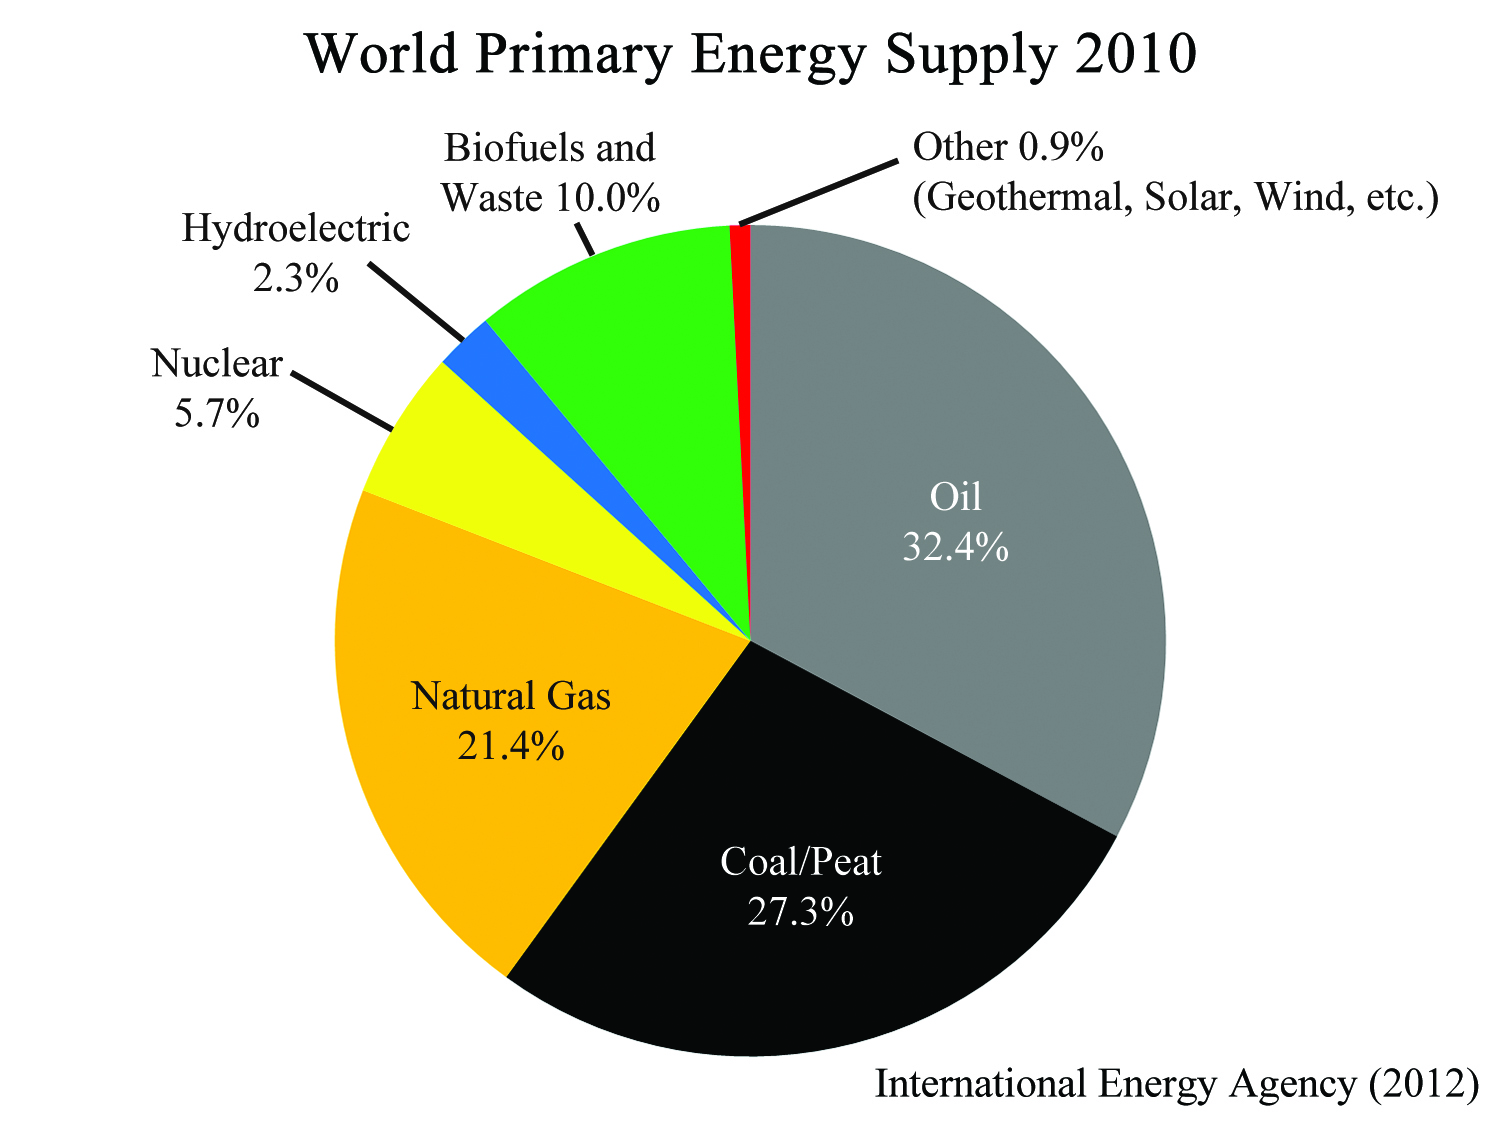
Yet, world economies remain overwhelmingly based on hydrocarbons. According to the International Energy Agency, in 2010 hydrocarbons provided 81 percent of the worlds energy, while wind and solar provided less than 1 percent. Denying hydrocarbon energy to developing nations is foolish and destructive policy.
Enlarged
The Equator Principles are ten principles for lending by international banks that work to the detriment of poor nations. Under pressure from environmental groups, Citibank, JP Morgan Chase, Bank of America, and 76 other banks in 32 countries adopted the Principles. These principles demand that banks lend in an “environmentally and socially responsible manner,” which sounds good. But a top objective of the Equator Principles is “to promote the reduction of emissions that contribute to climate change.” Lending capital is restricted for coal mines, oil refineries, and other hydrocarbon projects desperately needed to build the economies of developing nations.
At the same time, the theory of man-made warming appears increasingly shaky. Hundreds of studies show that Earth was warmer 1,000 years ago than it is today. Water vapor, not carbon dioxide, is Earth’s dominant greenhouse gas. Arctic sea ice recently reached a 30 year low, but Antarctic Sea ice is near a 30 year high. More than double the polar bears roam the Arctic today than in 1960. History shows that droughts, floods, and storms are neither more frequent nor more severe than in past decades. Sea levels are rising at only about 7‒8 inches per century. Global temperatures have not risen for more than ten years, contrary to predictions by the leading climate models.
The tragedy of Climatism is a misuse of resources on a vast scale. Over $250 billion is spent each year in a futile effort to decarbonize - twice global foreign aid. The world spent over $1 trillion in the last ten years and is on track to spend another trillion in the next four years in a fight against a climate change phantom.
At the same time, real life and death problems need to be addressed. According to United Nations figures, 25,000 people die from hunger-related issues each day. More than one billion people try to survive on less than $1.25 per day. Two and one half billion lack adequate sanitation, 1.4 billion lack electricity, and almost one billion lack clean drinking water. Every year, two million die from AIDS. Almost one million die from tuberculosis. Malaria, pneumonia, and diarrheal diseases kill millions more.
Suppose we reallocate the billions spent in the foolish fight against global warming toward solving the real problems of humankind?
Steve Goreham is Executive Director of the Climate Science Coalition of America and author of the new book The Mad, Mad, Mad World of Climatism: Mankind and Climate Change Mania.
Non-comprehensive, none-of-the-below, Washington-dictated energy policies guarantee decline
By Craig Rucker
“We can’t have an energy strategy that traps us in the past,” President Obama proclaimed in March 2012. “We need an energy strategy for the future, an all-of-the-above strategy for the Twenty First Century that develops every source of American made energy.”
At first blush, this sounds like common sense. The US economy and lifestyle “depend on inexpensive and plentiful energy,” the Congressional Research Service noted in a 2005 report, but people tend to forget this until world events cause gasoline prices to spike. Then Washington reacts, CRS continued passing the Energy Policy Acts of 1992, 2005 and 2007. However, the US still does not have a “comprehensive long term energy policy” that balances increasing supply with conservation and defines the proper interplay between government and market forces.
Forty years ago, President Nixon announced “Project Independence,” in response to the 1973 oil cutoff by Middle East and other OPEC nations, with the goal of ensuring that “Americans will not have to rely on any source of energy beyond our own.” His broad-based strategy begat the trans-Alaska pipeline (to get North Slope oil to Lower 48 markets), expanded onshore and offshore oil drilling, an all of the above strategy for electric power generation that brought lignite mining and natural gas into prominence, and a host of conservation measures, including 55 mph speed limits.
President Carter brought very different thinking to Washington, policies that many believe led to declining US oil and gas production and economic “malaise.” President Reagan reversed Carter, but his successors, Congress, courts, environmental activists, regulatory agencies and disparate corporate interests launched American energy policies on a roller coaster ride. This history helps explain why comprehensive long-term energy policies and strategies are less logical and desirable than at first blush.
The term itself suggests policies devised and dictated by Washington, DC politicians, bureaucrats, lobbyists and pressure groups, many of whom have no real knowledge of or hands-on experience with energy, economics, science, technology, business or job creation.
In too many cases, the policies, strategies, laws, programs and regulations are crafted to promote specific ideologies, benefit companies and organizations with the best lobbyists, and secure tax breaks, subsidies and preferential treatment for political cronies, campaign contributors and politically correct ideas.
“All of the above” too often means all of the above ground and little or nothing below the Earth’s surface: wind, solar, biofuels and wood, for example but little or no oil, gas, coal or uranium. In fact, more than any other in history, the Obama administration is using its executive powers to delay, obstruct, hyper regulate, penalize and bankrupt the proven energy that is the foundation of modern living standards.
Similarly, the notion that proven energy strategies “trap us in the past” fails to recognize that “past” energy technologies (oil, gas, coal, nuclear and hydroelectric) actually provide 94% of the energy that powers America today; are abundant, reliable and affordable; and represent a monumental improvement over the wind, solar, wood, dung and water wheel power that feebly energized mankind for millennia.
Suggesting that we can abandon these vital 94% energy sources in favor of new variations on antique technologies that Mr. Obama promotes as energy of “the future” ignores the fact that these politically correct sources are expensive, intermittent, heavily subsidized and wholly dependent on fossil fuels. Moreover, any honest and meaningful cradle to grave analysis of wind, solar and biofuel energy reveals that these PC sources are land and resource intensive, environmentally damaging, and unsustainable.
The “comprehensive longterm energy policies and strategies” slogan also ignores where the real progress of recent years has been made: in the private sector, especially the petroleum industry, where revolutionary horizontal drilling and hydraulic fracturing technologies have unlocked centuries of oil and natural gas worldwide. In fact, “fracking” on state and private lands has sent US petroleum production to new heights, even as Washington politics and policies have ensured that production from federally owned and controlled onshore and offshore lands continues to decline.
Hydrocarbon, hydroelectric and nuclear have undeniable problems: oil spills, air and water pollution, radiation and accidents. But laws, regulations, technologies and greater corporate responsibility have greatly reduced their frequency and severity and errors are quickly and severely punished.
By contrast, human health and environmental impacts associated with wind, solar and biofuel energy are routinely and systematically ignored, and almost never punished. The slaughter of millions of birds and bats annually by US wind turbines is a case in point, and when the impacts are considered in the context of the minimal energy produced via these “renewable” technologies, the damage is especially egregious.
These “alternative” technologies ALSO require perpetual subsidies, taken from hardworking taxpayers and productive sectors of our economy, and given to crony corporatists whose schemes slide repeatedly into bankruptcy. They employ rare earth metals and other raw materials that require vast amounts of fossil fuels, monumental earth removal and widespread land degradation to build and operate facilities whose energy is so expensive it kills 2 to 4 jobs for every “green” job created, drives families deeper into poverty, and impairs human health and welfare.
Forty years ago, President Nixon actually sought to develop and utilize “all of the above” energy every practical source on every list. Today, amid an anemic economy and joblessness far worse than official government figures admit, President Obama balks at approving the Keystone XL pipeline, cancels leasing and drilling on federal lands, tells our budget sequestered military to buy $26 to $67 per gallon ship and jet fuel, punishes refineries for not buying cellulosic ethanol that doesn’t exist, and happily lets EPA shut down coal-fired power plants and kill countless thousands of mining, utility and other jobs.
Thoughtful Americans find little comfort in these policies. Twelve million still cannot find work in this moribund, DC-dictated economy. Red-state Democrats like Joe Manchin (D WV), Mark Begich (D AK) and Mary Landrieu (D LA) tremble at the prospect of facing voters in 2014. And outrage is properly growing over the massive failures of wind, solar and biofuel startups whose executives (mostly Obama and Democrat campaign angels) skimmed millions of tax dollars for themselves but let their companies go bankrupt and their employees go on unemployment and welfare rolls.
And still President Obama and his minions push for punitive carbon dioxide regulations and carbon taxes, while the European carbon market collapses, EU jobs head to China and India, and thousands die of hypothermia in England. The European emissions trading system is “below junk status,” according to The Economist, and the collapse has been felt as far away as Australia, whose political leaders prepare to reap the whirlwind of carbon taxes that are now 5.5 times higher than in Europe. Is this America’s “future”?
Will ideology continue to trump sanity in the Obama energy and climate policy arenas? The President is putting all his eggs in the basket of “hope” that Democrats will “change” the House leadership and extend their Senate majority in 2014. He has shown little desire to compromise on energy and climate change.
America does not need “comprehensive” energy policies devised and dictated by Washington. It needs policies that unlock our creative genius and allow free enterprise and private sector innovators to operate on a level playing field, one that applies the same reasonable, responsible environmental, endangered species, tax, subsidy and other laws and standards to all companies, investors and energy technologies.
We need simple laws and policies that let our ultimate energy resource (our creative intellect) work without ideologues, pressure groups and regulators promoting failed, subsidized energy schemes, while continuing to block affordable, dependable energy that actually creates jobs and generates revenues.
------
Craig Rucker is executive director of the Committee For A Constructive Tomorrow (http://www.CFACT.org)
ICECAP NOTE: ICECAP has reached another milestone, exceeding 40 million page hits. THANK YOU.
Thank you for your continued support through donations which help us pay the monthly maintenance and security. You can support our effort through the donation button (small amounts are welcome) or by joining Joe Bastardi, Ryan Maue and I at Weatherbell.com, where we do multiple daily posts and specialized forecasts.
-------------
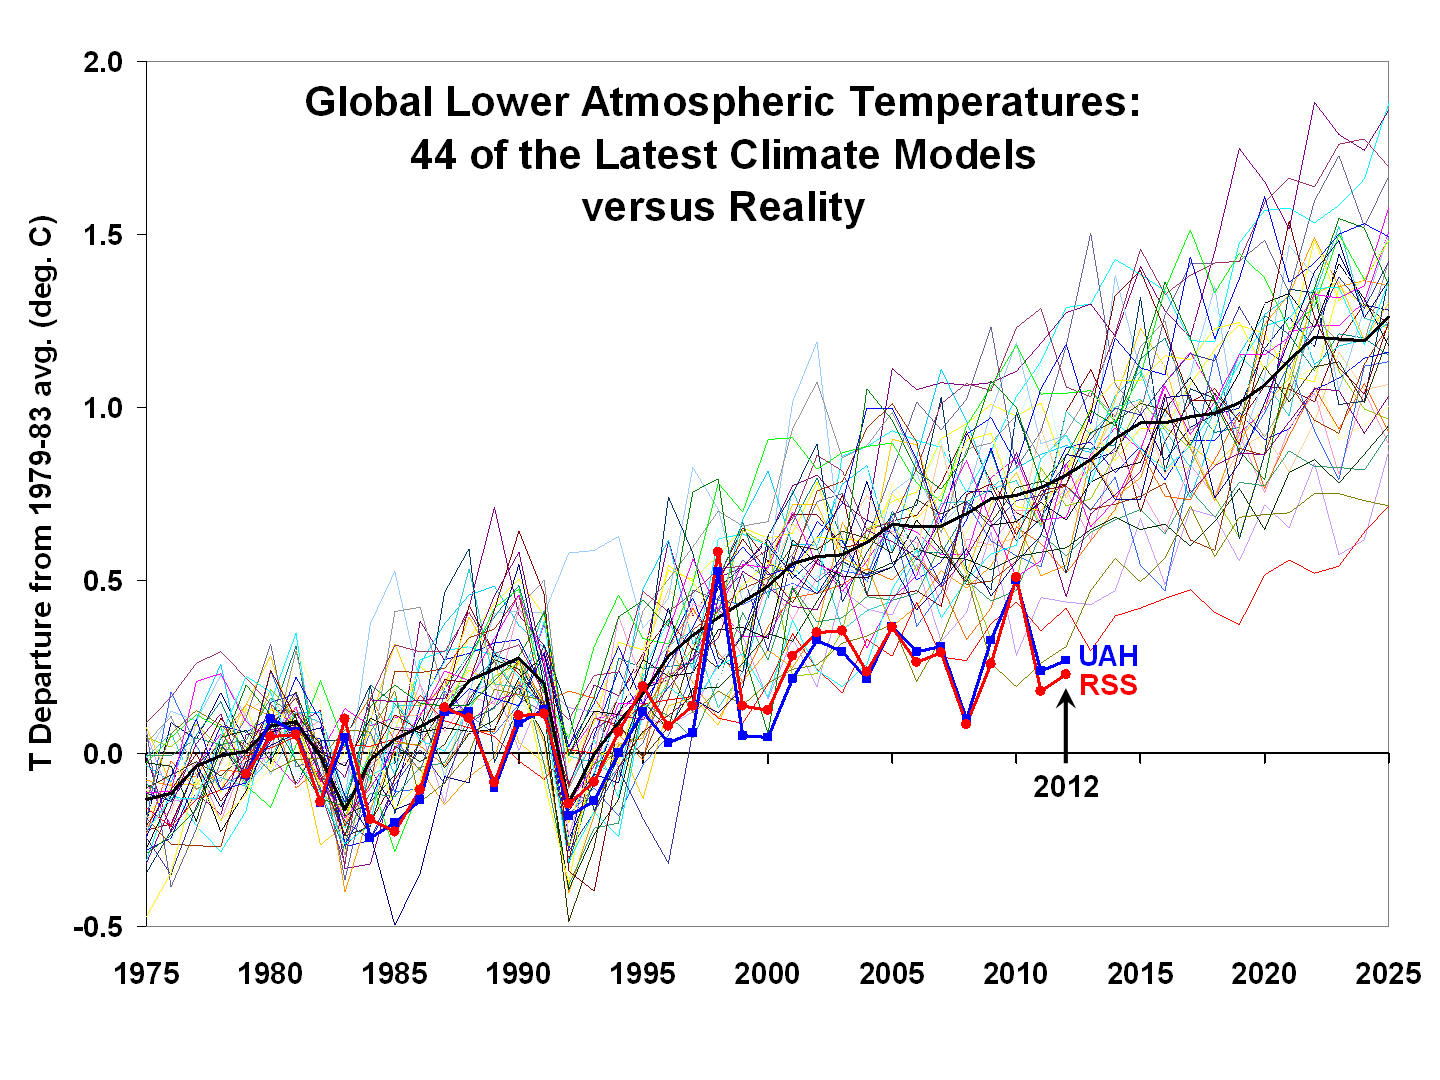
By Dr. Roy Spencer
April 16th, 2013
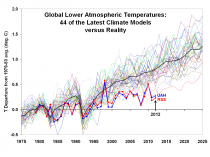
Since the slowdown in surface warming over the last 15 years has been a popular topic recently, I thought I would show results for the lower tropospheric temperature (LT) compared to climate models calculated over the same atmospheric layers the satellites sense.
Courtesy of John Christy, and based upon data from the KNMI Climate Explorer, below is a comparison of 44 climate models versus the UAH and RSS satellite observations for global lower tropospheric temperature variations, for the period 1979 to 2012 from the satellites, and for 1975 to 2025 for the models:
Clearly, there is increasing divergence over the years between the satellite observations (UAH, RSS) and the models. The reasons for the disagreement are not obvious, since there are at least a few possibilities:
1) the real climate system is not as sensitive to increasing CO2 as the models are programmed to be (my preferred explanation)
2) the extra surface heating from more CO2 has been diluted more than expected by increased mixing with cooler, deeper ocean waters (Trenberth’s explanation)
3) increased manmade aerosol pollution is causing a cooling influence, partly mitigating the manmade CO2 warming
If I am correct (explanation #1), then we will continue to see little warming into the future. Additional evidence for lower climate sensitivity in the above plot is the observed response to the 1991 Pinatubo eruption: the temporary temperature dip in 1992-93, and subsequent recovery, is weaker in the observations than in the models. This is exactly what would be predicted with lower climate sensitivity.
On the other hand, if Trenberth is correct (explanation #2), then there should be a period of rapid surface warming that resumes at some point, since the climate system must eventually try to achieve radiative energy equilibrium. Of course, exactly when that might be is unknown.
Explanation #3 (anthropogenic aerosol cooling), while theoretically possible, has always seemed like cheating to me since the magnitude of aerosol cooling is so uncertain it can be invoked in any amount desired to explain the observations. Besides, blaming a lack of warming on humans just seems a little bizarre.
The dark line in the above plot is the 44-model average, and it approximately represents what the IPCC uses for its official best estimate of projected warming. Obviously, there is a substantial disconnect between the models and observations for this statistic.
I find it disingenuous for those who claim that, because not ALL of individual the models disagree with the observations, the models are somehow vindicated. What those pundits fail to mention is that the few models which support weaker warming through 2012 are usually those with lower climate sensitivity.
So, if you are going to claim that the observations support some of the models, and least be honest and admit they support the models that are NOT consistent with the IPCC best estimates of warming.
----------
SOLAR INFLUENCE ON GLOBAL TEMPERATURE
Citation: Center for the Study of Carbon Dioxide and Global Change. ”Solar Influence on Global Temperature.” Last modified April 17, 2013
The claim that anthropogenic greenhouse gas emissions have been responsible for the warming detected in the twentieth century is based on what Loehle (2004) calls “the standard assumption in climate research, including the IPCC reports,” that “over a century time interval there is not likely to be any recognizable trend to global temperatures (Risbey et al., 2000), and thus the null model for climate signal detection is a flat temperature trend with some autocorrelated noise,” so that “any warming trends in excess of that expected from normal climatic variability are then assumed to be due to anthropogenic effects.” If, however, there are significant underlying climate trends or cycles-or both-either known or unknown, that assumption is clearly invalid.
WASHINGTON - The military officer charged with monitoring North Korea at a time when the rogue nation is threatening to unleash missile attacks worldwide has used a Senate hearing to double down on his claim that it is global warming that is the real danger.
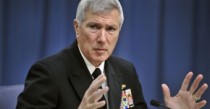
Navy Adm. Samuel Locklear III originally caused a stir just weeks ago when in a speech to scholars at Harvard and Tufts universities in Cambridge, Mass., he said the climate change factor should be the focus of American concern.
At today’s hearing before the Senate Armed Services Committee he defended his assessment that global warming is the greatest threat to security in that part of the world.
According to the Boston Globe, Locklear said earlier, “significant upheaval related to the warming planet… is probably the most likely thing that is going to happen ...that will cripple the security environment, probably more likely than the other scenarios we all often talk about.”
At today’s hearing, Sen. James Inhofe, R-Okla., challenged him, and the admiral doubled down.
Locklear said 70 percent of the world’s expected growth will be in East and South Asia and it “will be moving along the coastal centers” it serves as a possible form of regional destabilizing via population displacement because of rising oceans.
But Inhofe pointed out that scientists disagree with the notion that the climate is changing. He furthermore said that such a belief is one that is held by “environmentalist extremists” who “do not believe in” having a large military.
He said he “cannot recall a time where the world was more dangerous” and Barack Obama’s military cuts are naive and put the U.S. forces “at risk.”
The idea of anthropological climate change has been the focus of many studies and reports in recent years. In 2007, WND reported that a study released by the Danish National Space Center suggested that “the sun still appears to be the main agent in global climate change” rather than by man.
Furthermore, last week WND reported that the scientific journal Science published a report showing dramatic increases in global temperature in the 20th century. While it was touted as a major study, it has now come under scrutiny after scientists involved “quietly admitted that surging temperatures can’t be supported by their data.”
Inhofe himself has been a leading voice challenging the vast assumptions on anthropological climate change. On a related topic, in 2012 Inhofe spoke to WND, saying that “green extremists” are jeopardizing America’s defense by devoting scarce resources to alternative energy, rather than defense development.
Locklear is the chief of the U.S. Pacific Command.
Read more
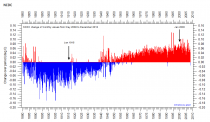
See this fact checking analysis on the claims being made about severe weather related to warming (which stopped 15 to 17 years ago). (NCA_DAleo_04-12-13.doc)
A retired Western Washington University professor testified to a Republican-controlled state Senate committee Tuesday that climate change stopped in 1998 and that human-caused greenhouse gases are not responsible for fluctuations in the Earth’s temperatures or melting polar ice caps.
The startling testimony from emeritus professor Don Easterbrook is at odds with an apparent consensus among climate scientists and climate-science literature about human causes behind the the rise in global temperatures over the past century. His testimony came one day after the Legislature sent Gov. Jay Inslee a bill that sets up a legislative work group to study Washington’s best strategy for addressing climate change.
Substitute Senate Bill 5802 creates a four-caucus study panel that will hire a consultant to study state options for cutting greenhouse gas emissions to 1990 levels by 2020, and how best to accomplish that at least cost. Republican Sen. Doug Ericksen of Ferndale, who invited Easterbrook to testify at his committee, could become Senate Republicans’ representative on that panel.
It is unclear what effect Easterbrook’s testimony—and his critique of Inslee’s original bill—will have on that bipartisan study work, if any. But the geology professor’s statements stunned Democratic Sen. Kevin Ranker of Orcas Island and other Democratic members of the Senate Energy, Environment and Telecommunications Committee who listened with skepticism, if not incredulity.
Ranker and Sen. Andy Billig, D-Spokane, took issue with Easterbrook’s assertion that NASA, the National Science Foundation and National Oceanographic and Atmospheric Administration would “manipulate” climate data and create a false impression that climate change is real and that global temperatures are rising. They argued there is an apparent consensus in scientific literature.
Enlarged. Change in data after 2008 with removal of UHI adjustment and other changes.
“They have frankly tampered with the data ... Mine is the original data,” Easterbrook said at one point. Pressed on this by Ranker, he added it wasn’t anything “scurrilous” done by the science panels but he insisted that data had been “adjusted” in ways that made it less accurate than his interpretations.
ICECAP NOTE: Here is Davis CA, in Barbara Boxer’s district showing the adjustments that created warming from cooling. Then we show the before and after sets with contaminants left in post 1980.
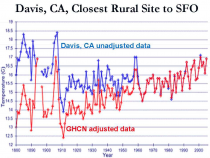
His own reading of data, Easterbrook said, showed there were 20 periods of global cooling and heating over the past 500 years with the most recent cooling trend beginning in 1998 and likely to last up to 25 or 30 years. He asserted that his work was peer reviewed and indicated that he could provide that information to Ranker.
Among Easterbrook’s assertions: that polar ice caps are not melting or shrinking; that sea level not is rising in many places including Neah Bay; that sea water is not becoming acidic due to carbon dioxide, although he said oceanic and Puget Sound waters may be becoming less alkaline as a result of pollutants; and that carbon dioxide is too scarce in the planet’s atmosphere to produce climatic change. All were point-by-point refutations of claims Inslee had made in his own testimony on the bill.
But Ranker wasn’t buying it and at one point said: “The last 12 years were the hottest on record. That’s peer reviewed data I have before me.”
“I can’t answer why it is different,” Easterbrook replied, indicating he was relying on public data he has collected globally. “What I can tell you is this is original data” that had not been adjusted.
Ericksen said before the session that he wanted his committee to operate in an open and fair way and that he believed it is important to hear all sides—and that the public has many views about climate change. He also noted that the presentation comes after Inslee’s climate bill was passed. But Ericksen also questioned Easterbrook’s data at one point—saying that data for the 1930s, which the professor claimed was the hottest period on record—appeared to be cooler than temperatures today.
But in his closing remarks Ericksen thanked Easterbrook and suggested that there are unsettled questions that require lawmakers to look at “all the data that is available to us to make an informed decision.”
“I thought it was a very interesting presentation. I think obviously there are disagreements in Olympia and in the scientific world with regards to the material you presented,” Ericksen said.
Ranker said he hoped Ericksen’s decisions to hear questionable testimony was not a sign that the governor’s climate work group would get derailed. He said the question that needs to be answered is what is the best state response to climate change—not whether it is happening.
“We know conclusively we have had the hottest, days, years, months on record in the last decade or more. It just continues,” Ranker said. “The portrayal that this is a conspiracy—he said that three times to me that the data I’m looking at was manipulated by NOAA and NASA and the National Science Foundation—I find that extremely hard to believe.”
BREAKING NEWS: Hansen to leave NASA
Justin Gillis, NY Times
James E. Hansen, the climate scientist who issued the clearest warning of the 20th century about the dangers of global warming, will retire from NASA this week, giving himself more freedom to pursue political and legal efforts to limit greenhouse gases.
Marveling at the efficiency of a killer in the skies and NASA’s household name on climate change takes his fight for the earth’s future into retirement.
His departure, after a 46-year career at the space agency’s Goddard Institute for Space Studies in Manhattan, will deprive federally sponsored climate research of its best-known public figure. At the same time, retirement will allow Dr. Hansen to press his cause in court. He plans to take a more active role in lawsuits challenging the federal and state governments over their failure to limit emissions, for instance, as well as in fighting the development in Canada of a particularly dirty form of oil extracted from tar sands.
“As a government employee, you can’t testify against the government,” he said in an interview.
Dr. Hansen had already become an activist in recent years, taking vacation time from NASA to appear at climate protests and allowing himself to be arrested or cited a half-dozen times. But those activities, going well beyond the usual role of government scientists, had raised eyebrows at NASA headquarters in Washington. “It was becoming clear that there were people in NASA who would be much happier if the ‘sideshow’ would exit,” Dr. Hansen said in an e-mail.
----------
Jeff Montgomery, The (Wilmington, Del.) News Journal 4:36p.m. EDT March 19, 2013
Personal, economic freedom groups sponsor talk about global warming ‘scare tactics.”
(Photo: Jason Mint, The News Journal, Wilmington, Del.)
STORY HIGHLIGHTS
250 came for the forum with a Harvard-Smithsonian researcher, former Delaware state climatologist
One of them is a member of Delaware’s Sea Level Rise Advisory Committee
Natural coastal erosion is a bigger worry than sea level, he says
GEORGETOWN, Del. - One of the nation’s more controversial climate-change skeptics dismissed warnings about sea-level rise and global warming as “scare tactics” and “sick” science in a talk here.
Willie Soon, a researcher at the Harvard-Smithsonian Center for Astrophysics, and Professor David Legates of the University of Delaware, a former climatologist for the state, bluntly rejected leading climate change claims during the Monday event organized by two nonprofit groups that promote personal and economic freedoms, the Positive Growth Alliance of Millsboro, Del. and the Caesar Rodney Institute of Dover, Del.
“They’re a very sick group,” Soon said. “They’re not talking about science at all. It is all agenda-driven, science results."”
The comments came during a session that one organizer later said should be a call to oppose efforts to base land-use and other policies on forecasts of significant, long-term sea-level rise.
Director Richard Collins of the Positive Growth Alliance said the program, which drew about 250 people, was planned to counteract “outrageous” claims about global warming and its consequences.
“You’re going to find out later that there is deliberate deception going on,” Collins said during his introduction of the evening’s speakers.
Collins also is a member of Delaware’s Sea Level Rise Advisory Committee, a group scheduled to release a plan this summer for adapting to climate change in coming decades.
The group, formed by the state Department of Natural Resources and Environmental Control, based its efforts on forecasts of possible sea-level increases of 1.6 to 5 feet in the next century. It has recommended dozens of policies for consideration.
Legates, asked to step down as climatologist in 2011, said state policymakers never asked his opinion on climate change or sea-level rise while he had the position.
He thinks Delaware should focus on responses to severe, natural coastal erosion rather than strict sea-level rise.
“There is no clear signal of sea-level rise in Delaware,” Legates said.
Some environmental groups have pointed to Soon’s and Legates’ ties to organizations financed by fossil fuel and deeply conservative interests, including the George C. Marshall Institute in suburban Washington and the Chicago-based Heartland Institute.
Queue the P Pielke Jr. convenient button which describes most everything enviro groups and the advocacy group UCS say:

Geologic factors, mainly subsidence in coastal areas, account for the apparent and future long-term sea-level rise, Legates said.
The rise “essentially disappears” once subsidence is accounted for, he said, in contrast to warnings that sea-level increases could reach 6 feet by 2100.
“There’s lots of variability,” said Legates, who noted that the United Nations’ Intergovernmental Panel on Climate Change had steadily reduced its sea-level rise estimates in the past decades.
Legates pointed to North Carolina’s recent efforts to develop land-use policies based on accelerating sea-level rise and claimed that developers had used skewed data that eventually undermined the effort.
Secretary Collin P. O’Mara of Delaware Department of Natural Resources and Environmental Control said Thursday that scientific agreement on the process and prospect of global warming, climate change and its link to human activities was “overwhelming.”
“We are past this being a theoretical problem,” O’Mara said. “We’re experiencing exactly what the climate models predict: warming global temperatures, more extreme weather events, sea-level rise.” See BS button above.
“Rather than rehashing settled science, we need to focus our efforts on how to reduce emissions most cost effectively, improve the resiliency of vulnerable communities and strengthen our economy in the process,” he said.
Maureen Leary, a Georgetown resident who attended the session, said she has doubts about the threat despite U.N. studies warning that some amount of damaging warming and sea-level rise already appears unavoidable.
“I’m not sure that I believe the predictions,” Leary said.
By P Gosselin on 22. March 2013
UPDATE: “This March could be the coldest of the last 100 years,” says meteorologist Dominik Jung - See here!
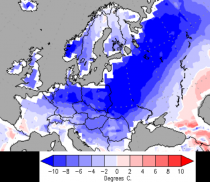
Europe’s bitter cold winter refuses to let up!
For some areas we are now hearing that it is being called the “100-year winter”.
Temperature forecast anomaly for the next 7 days.
For example, Berlin’s online daily Tagesspiegel writes today:
Berlin freezes in 100-year winter.
Lots of snow and bitter cold until the end of March - Berlin hasn’t seen this in more than 100 years.”
Forget the tall tales spread by Mojib Latif. We haven’t forgotten what real winters are. We just haven’t seen anything like this since measurements began in 1895!
The Tagsspeigel writes:
‘There has never been anything like this in Berlin in the last third of March since snow measurements began in 1895,’ says weather expert Friedemann Schenk of the Meteorological Institute for the Freien Universitat (FU).”
The English-language The Local here reports that Germans should not expect spring to arrive anytime soon, as the German Weather Service (DWD) warns that “the record-breaking wintry weather will continue until Easter”.
This weekend will be especially cold. T online news site writes:
In the east, temperature readings will drop dramatically - many readings will be -10C, as low as -13C in some spots. “Some cold records for end of March will fall,” prophesies Ruhnau.”
Germany’s RBB forecasts temperatures down to -15C! The extreme cold overall will make this March in Central Europe the coldest and snowiest in over 40 years at least.
The Local adds:
Record-breaking levels of snow fell in other areas of the northeast namely in Laage, Mecklenburg Western-Pomerania, where a blanket of 27 centimetres of snow smashed the region’s previous 2005 record for the time of year by six centimetres. “For March 20th, the amounts are impressively high,” said Simon Tripper, a meteorologist from the DWD, on Wednesday afternoon.
See two part series on climate change and politics with Art Horn and I and Bryan Donavan. Part Ii is shown first.
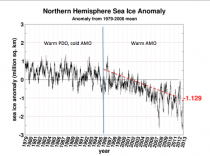
Alarmists are trying to blame the cold and snowy winter on lack of arctic ice which they claim results in more blocking. Even my friend Tom Skilling has bought into this nonsense. The arctic ice has a strong correlation with Atlantic warm and cold cycles. The current warm cycle which began in 1995 led to gradual decline in arctic ice. The AMO also correlates with blocking. Whats more important is that is summer ice reduction. The ice has recovered to the middle of the pack by late fall.
By Joseph D’Aleo, CCM
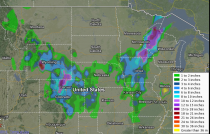
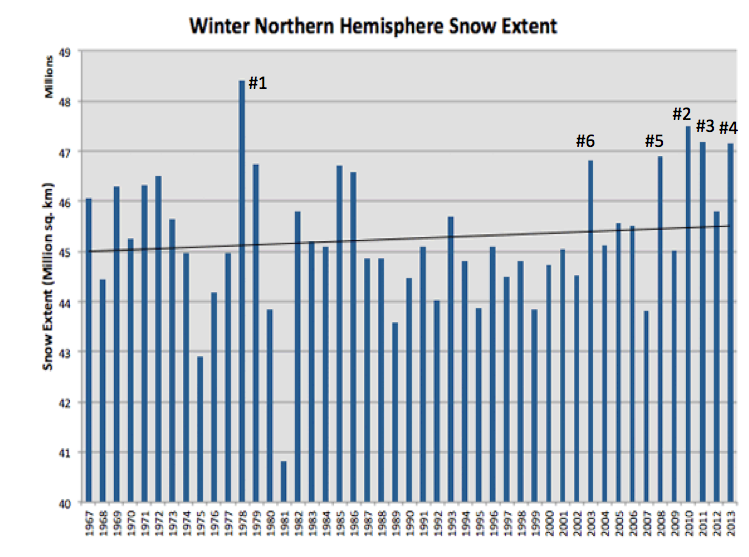
Rutger’s monthly snow data is in. November was 5th snowiest, December was the snowiest ever, January the 6th snowiest and February 16th snowiest. The winter as a whole was 4th snowiest.
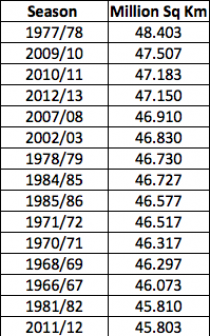

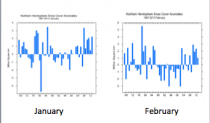

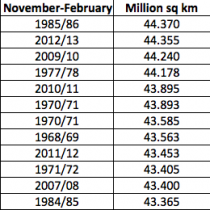
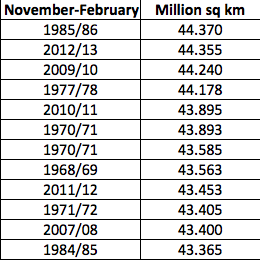
As a whole the winter ranked 4th behind 1977/78, 2009/10, 2010/11, (2012/13) and ahead of 2007/08 and 2002/03. That means 5 of the top six snowiest winters for the northern hemisphere have occurred since 2002/03. When i averaged Novermber to February, 2012/13 jumped to #2.
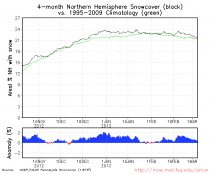
In the November to February average, 2012/13 jumped to #2.

If the snow keeps coming the next few weeks, I suspect November to March will become #1.!!!!
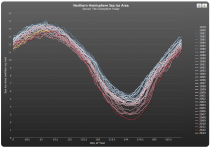
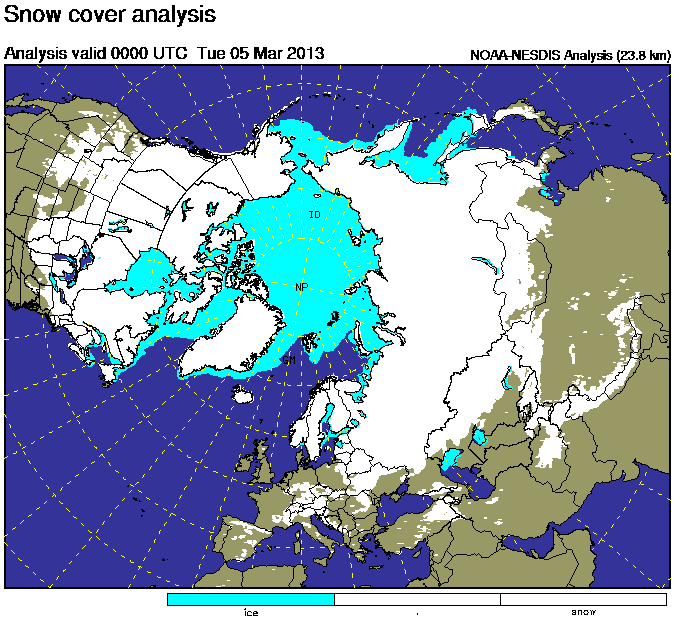
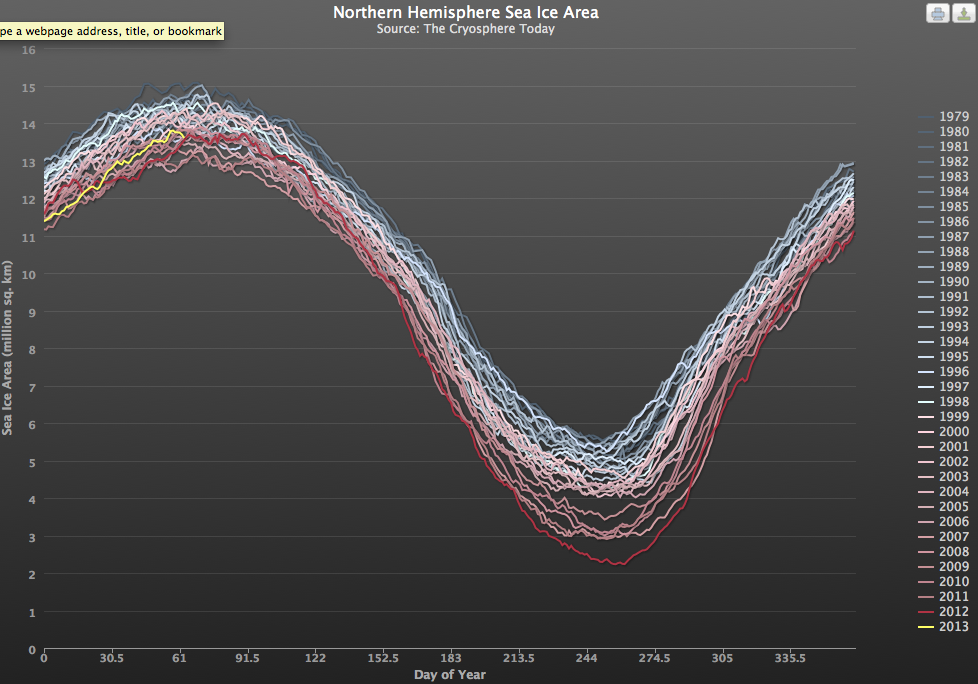
Oh and the arctic ice is near the middle of the pack. Still given the warm AMO, it should be low again next summer. The AMO is the driver for the cyclical changes in ice (see more here).

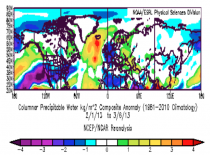
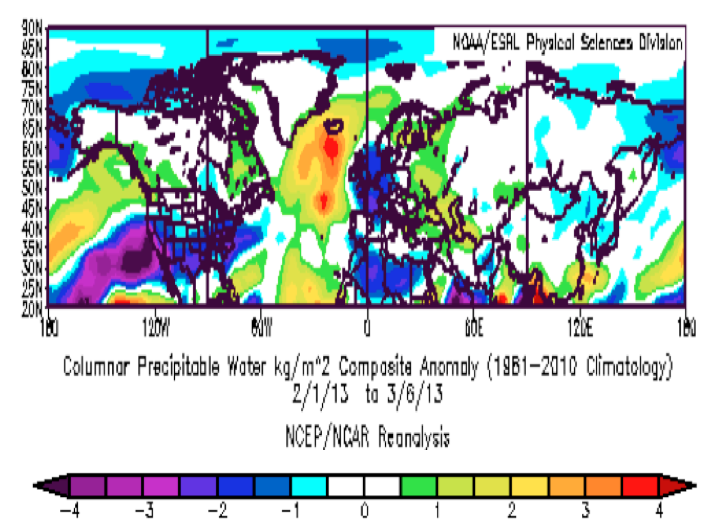
By the way, to counter the alarmist knee jerk claims that this is due to warm air which means more moisture which means more snow, here is the mean precipitable water for the northern hemisphere since February 1, when it turned snowy in the U.S. As you would expect when it gets cold, (necessary for snow), the amount of water vapor in the air drops. Blues are below normal, yellows and reds above.
.gif)